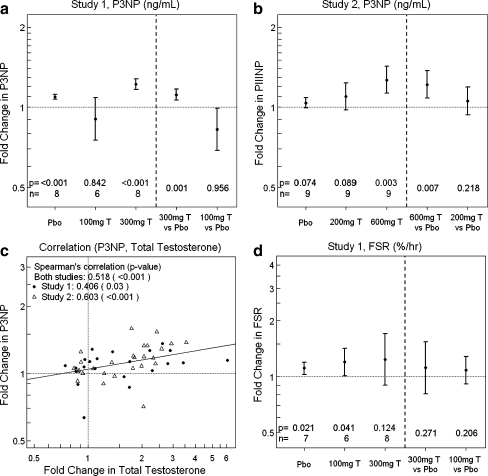
Fig. 2.
Plasma P3NP changes from baseline after 1-week testosterone treatment. a Plasma P3NP concentration is significantly increased from baseline with 300 mg testosterone (T) relative to placebo (study 1). b Plasma P3NP concentration is significantly increased from baseline with 600 mg T relative to placebo (study 2). c Scatter plot of change in P3NP from baseline vs. change in total testosterone from baseline (study 1, filled circle; study 2, empty triangle). A line fitted to the points is shown (r = 0.518, p < 0.001). d Change in skeletal muscle FSR after 1-week treatment with 300 mg testosterone, 100 mg testosterone, and placebo. There were no statistically significant changes in FSR relative to placebo. Y-axis is in log scale. X-axis in log scale (c). Values of p, sample size (n), mean, and 90% confidence intervals are shown

