Fig. 4.
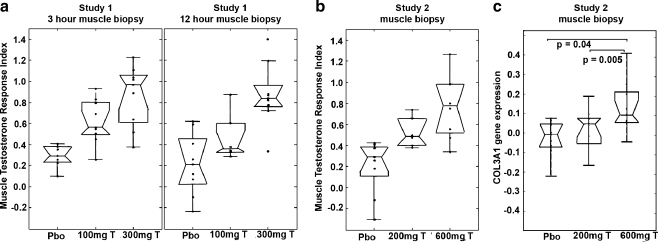
The MTR index gene signature demonstrates a dose-dependent increase with testosterone comparing change from baseline and 1-week treatment. a In study 1, the MTR was assessed twice at baseline and twice after 1-week treatment; muscle biopsy performed at 3 and 12 h after beginning the stable isotope infusion for measuring fractional synthetic rate. For comparison between groups, p < 3.9 × 10⁻⁵ (3 h) and p < 2.7 × 10⁻⁴ (12 h). b In study 2, MTR was assessed once at baseline and after 1-week treatment. For comparison between groups, p < 6.2 × 10⁻⁴. c Collagen 3 (COL3A1) RNA expression is increased with the testosterone 600-mg dose compared with testosterone 200-mg dose and placebo. The box has horizontal lines at the lower, median, and upper quartile values. Whiskers extend from each end of the box to the adjacent values in the data, the most extreme values within 1.5 times the interquartile range from the ends of the box. Outliers displayed are data with values beyond the ends of the whiskers

