
Fig. 10.
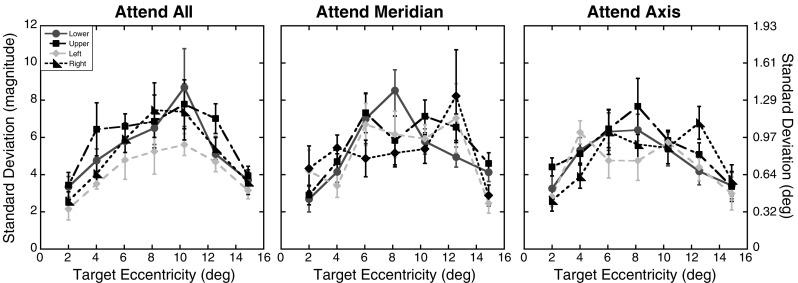
Experiment 3 positional uncertainty: Standard deviations of the magnitude errors as a function of target eccentricity (in degrees) and axis tested for the three attention conditions. The same formatting is used here as in Fig. 9. Error bars represent ±1 SE