
Fig. 12.
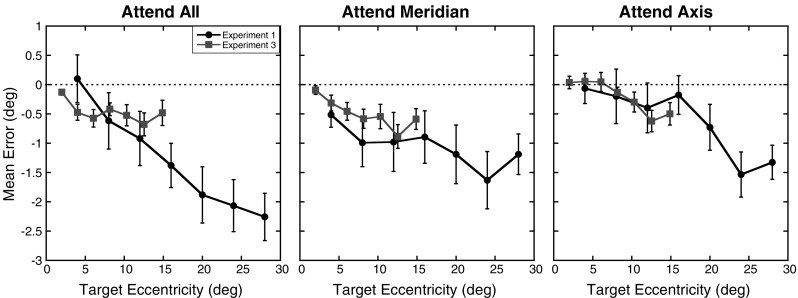
Comparison of errors across Experiments 1 and 3: Mean errors in degrees of visual angle as a function of experiment and target eccentricity (in degrees) for the three attention conditions. Errors from Experiment 1 are shown as circles, while the errors from Experiment 3 are shown as squares. Error bars represent ±1 SE. The dotted lines at 0 represent the expected performance if no distortion exists