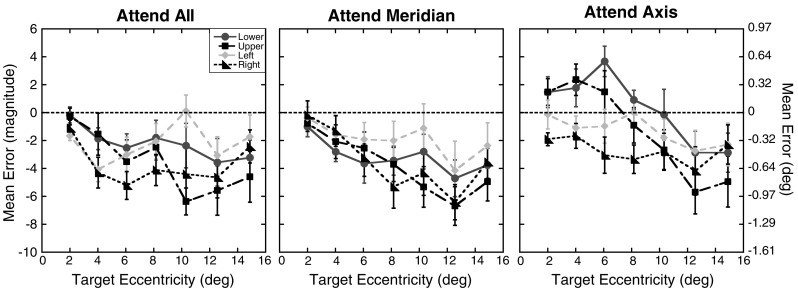
Fig. 9.

Experiment 3 magnitude errors: Mean magnitude errors for each of the four axes tested as a function of target eccentricity (in degrees) for the three attention conditions. The right y-axis shows the errors in units of degrees of visual angle. Results for the lower axis are shown as circles, those for the upper axis as squares, for the left axis as diamonds, and for the right axis as triangles. Error bars represent ±1 SE. The dotted lines at 0 represent the expected performance if no distortion exists
