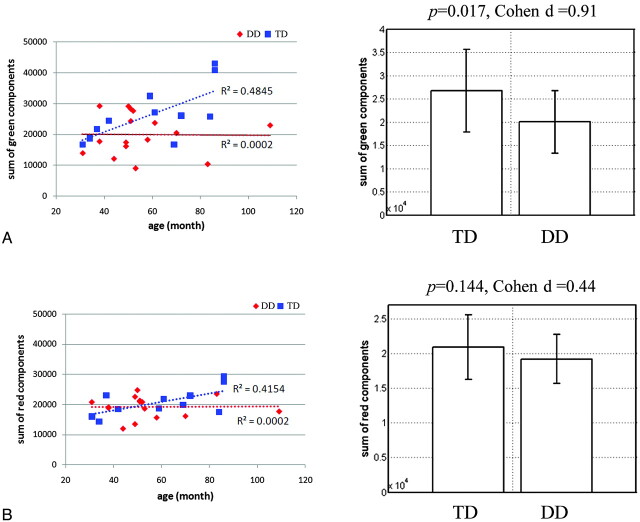
Fig 3.
Results of region-based-quantification analysis. A, Sum of the AP component. B, Sum of the ML component. For both groups, 2 metrics are correlated with the age of the individual subject in terms of the linear regression coefficient, R2 (left plot). The group mean and 1 SD of both metrics are displayed in the right plot.

