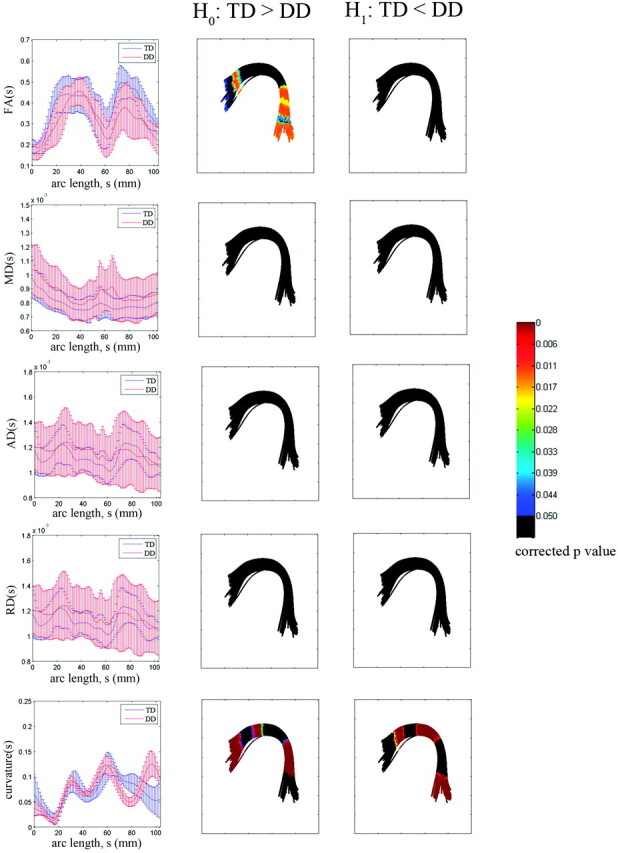
Fig 4.

TBM group analysis of the left AF bundle by using a TD prototype fiber. For each arc-length coordinate (in millimeters), each subject's mean FA, MD, AD, RD, and curvature values are computed for the left AF bundle. The group mean and SD of these per-subject means are shown versus arc-length (left column). The multiple-comparison corrected P value for a significant difference on H0 (TD > DD) or H1 (TD < DD) is overlaid on corresponding segments of the DD group bundle (middle and right columns).
