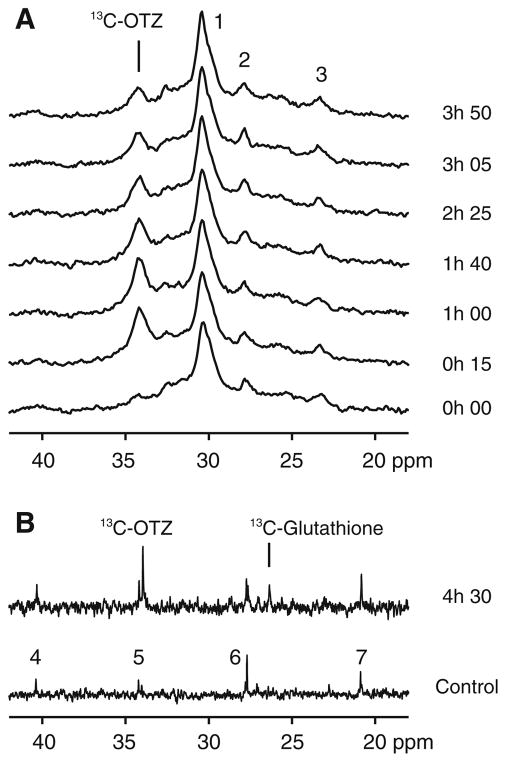
Fig. 2.
a A portion of the in vivo rat brain 13C magnetic resonance spectra acquired before and (bottom, t = 0 h 00) at six time points (15 min–3 h 50) after bolus injection of 1,100 mg/kg 13C-OTZ. b A portion of the high-resolution 13C magnetic resonance spectrum of the acid extract of brain tissue from the same rat (upper), and from a control rat (lower). Signals are detected from 13C-OTZ (34.2 ppm), 13C-glutathione (26.5 ppm), and natural abundance metabolites (including CH2 carbons of long chain fatty acids, principally (–CH2–)n (peak 1), –CH2–CH=CH–(peak 2) and CH2-CH3 (peak 3) carbons). Natural abundance resonances in the control brain tissue extract spectrum are assigned to N-acetyl aspartate (peaks 4 and 7), and glutamate/glutamine (peaks 5 and 6)

