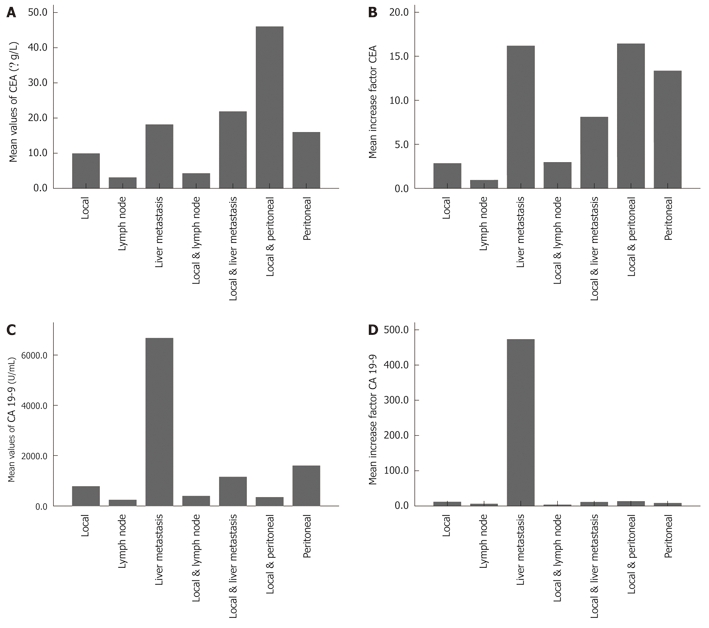
Figure 4.

Bar graphs of mean values and mean increase factors for carcinoembryonic antigen and carbohydrate antigen 19-9 stratified by type of recurrence. A: Mean values of carcinoembryonic antigen (CEA) (μg/L) at the time of recurrence stratified by type of recurrence; B: Mean increase factor of CEA (μg/L) (values at the time of recurrence divided by initial values) stratified by type of recurrence; C: Mean values of carbohydrate antigen 19-9 (CA19-9) (U/mL) at the time of recurrence stratified by type of recurrence; D: Mean increase factor of CA 19-9 (U/mL) (values at the time of recurrence divided by initial values) stratified by type of recurrence.
