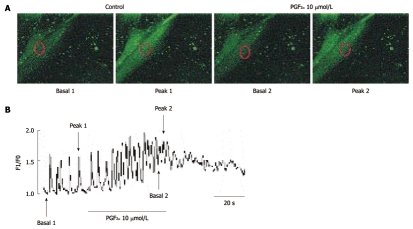
Figure 7.
Effects of Prostaglandin F2α on intracellular Ca2+ oscillations in cultured interstitial cells of Cajal from mouse small intestine. A: Sequential fluorescence intensity images of fluo-3-loaded cultured interstitial cells of Cajal under normal conditions. The representative frames indicate in (B) basal 1, 2, peak 1 and 2. The exposure time of each frame was 500 ms; B: Fluorescence intensity change plotted in (A) red marker in absence and presence of Prostaglandin F2α (PGF2α) (10 μmol/L). The horizontal solid line scales denote duration of fluorescence intensity change (s).

