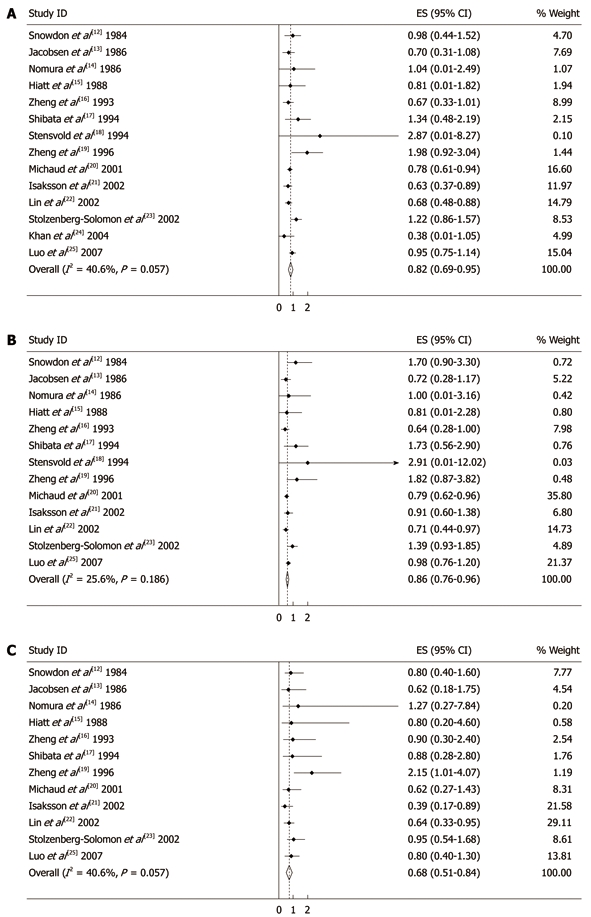
Figure 2.

Summary relative risks of pancreatic cancer for coffee drinkers vs non/lowest drinkers from included studies (A), low to moderate coffee drinkers vs non/lowest drinkers from included studies (B) and high coffee drinkers vs non/lowest drinkers from included studies (C). Weights are from random effect analysis. Squares represent study-specific relative risk estimates (size of the square reflects the study-specific statistical weight, that is, the inverse of the variance); horizontal lines represent 95% CIs; diamonds represent summary relative risk estimates with corresponding 95% CIs.
