
Figure 3.
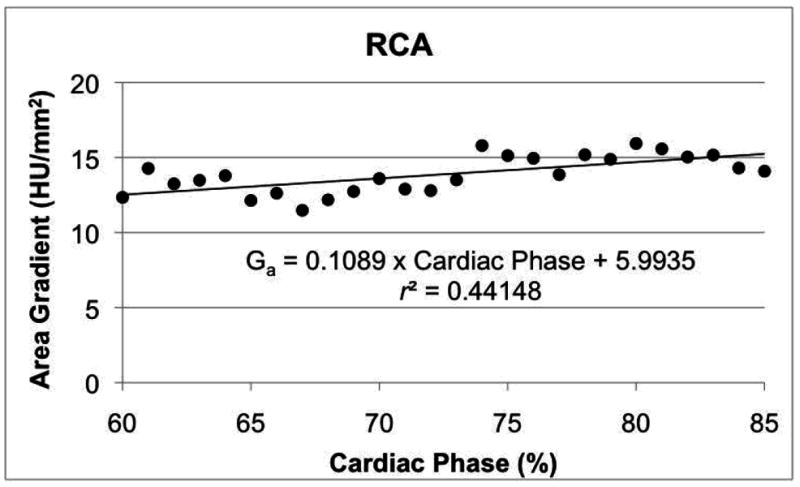
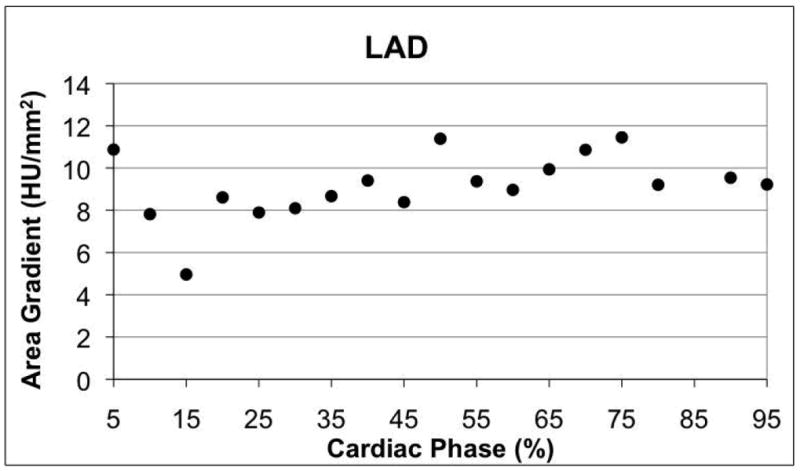
Variation of area gradient with respect to cardiac phase in diastole in one RCA (a) and through the entire cardiac cycle in the LAD of a different patient (b). Linear regression results are shown for the RCA, where the trend was significant (Table 5, p < 0.05).