
Figure 4.
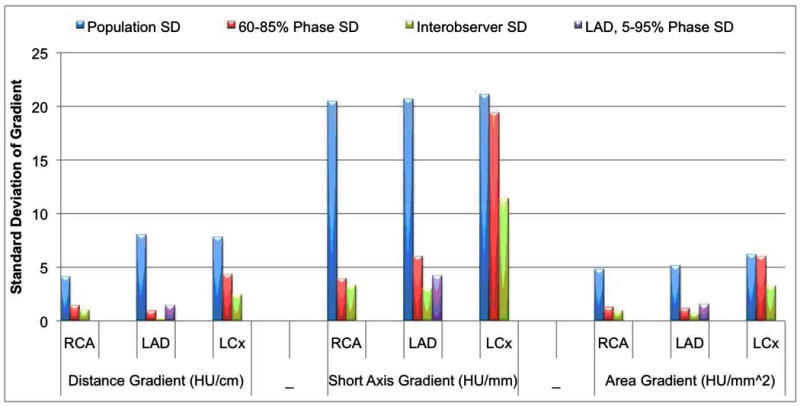
Standard deviation of the magnitude for all three gradients for the 36 patients with no CT evidence of CAD (blue bars), 60-85% cardiac phase in one patient (red bars), 5-95% cardiac phase at 5% intervals in a single LAD in one patient (purple bars), and between cardiovascular imagers performing the segmentation for 9 cardiac phases in one patient (green bars).