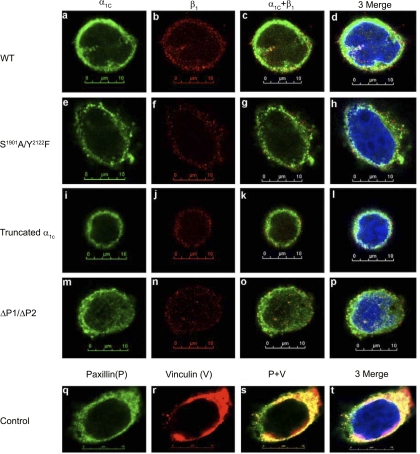
Fig. 8.
Confocal immunofluorescence image analysis to determine the distribution and association of α1C-CaL and β1-integrin on the plasma membrane. Representative confocal immunofluorescence images from the cells expressing WT-, truncated α1C-, S1901A/Y2122F-, or ΔP1/ΔP2-CaL. α1C and endogenous β1-integrin expression on the plasma membrane appear as green and red punctate staining in a, e, i, and m and in b, f, j, and n, respectively. The colocalization of α1C-CaL with β1-integrin on the membrane appears as yellow to orange punctate staining (c, g, k, and o). A noticeably higher degree of α1C-CaL colocalization with β1-integrin was seen in cells expressing WT-α1C-CaL, compared with mutant α1C-CaL construct-expressing cells. Merged images of the previous three panels with nuclei counterstaining appear in blue (d, h, l, and p). Endogenous paxillin and vinculin staining in HEK293-T cells appears as green and red in q and r, respectively. The degree of colocalization between paxillin and vinculin (yellow to orange staining; s) appears to be much higher than that between α1C-CaL and β1-integrin in the WT- or mutant α1C-CaL-expressing cells. Merged image with nuclear counterstaining in blue appears in t. Magnification, ×63 oil; scale bar, 10 μm.

