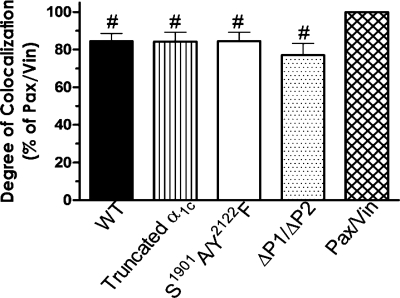
Fig. 9.
Bar graph showing the quantified degree of α1C-CaL association with β1-integrin normalized to the degree of paxillin (Pax)-vinculin (Vin) association using intensity correlation analysis (ICA). The association of paxillin with vinculin was set as 100%. The ICA value of α1C-CaL-β1-integrin association in WT α1C-CaL, truncated α1C-CaL, S1901A/Y2122F-α1C-CaL, or ΔP1/ΔP2 α1C-CaL is presented as the percentage of paxillin-vinculin association. Values were taken from at least 8 cells in either WT- or mutant CaL per experiment, and the values in the graph were calculated on the basis of the average of at least four experiments. Statistical analysis was performed on the basis of the average from at least four individual experiments. #P < 0.01 vs. the degree of colocalization between paxillin and vinculin.

