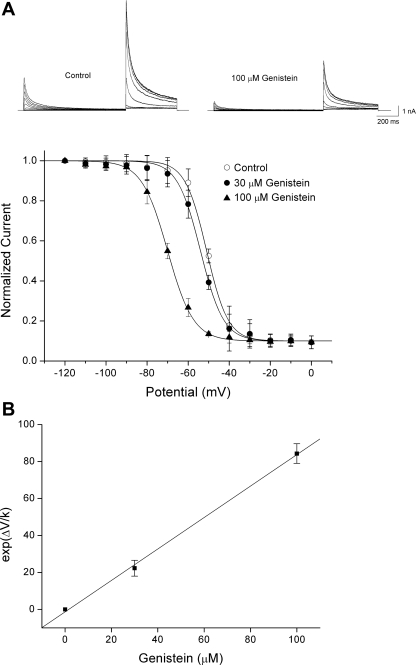
Fig. 5.
Effects of genistein on the steady-state inactivation of Kv4.3. A: the currents were evoked by 1-s prepulses that were varied from −110 to 0 mV stepped by 10 mV and a 500-ms depolarizing pulse to +40 mV in the absence and presence of 30 and 100 μM genistein. Steady-state inactivation curves are shown as a plot of normalized peak currents during the depolarizing pulse as a function of the conditioning potential. The curves represent the best-fit Boltzmann equations. B: plot of exp (ΔV/k) against genistein concentrations. The V1/2 and k values were obtained from the steady-state inactivation curves. The concentration-dependent shift in the midpoint (ΔV) was determined as the difference between V1/2 values in control conditions and at 30 and 100 μM genistein (n = 6). The solid line represents the linear fit of the data: exp (ΔV/k) = 0.64 + 0.85 [genistein], where [genistein] represents the genistein concentration. Ki, the reciprocal of the slope, was calculated from this fit. Values are means ± SE. See materials and methods for definitions of other terms.

