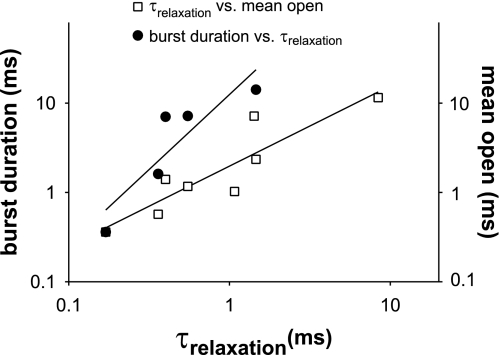
Fig. 9.
Relaxation times correlated with both mean open time and burst duration. Relaxation times from macropatches subjected to a step depolarization from +60 mV to −100 mV (1 and 10 μM Ca2+) or from +120 mV to −100 mV (nominally 0 μM Ca2+) were plotted against mean burst duration (left axis) or mean open times (right axis). To make valid comparisons, the values for both mean open times and mean burst times were obtained at the corresponding voltage and Ca2+ concentrations (+60 mV with 1 or 10 μM Ca2+ and +120 mV with nominally 0 μM Ca2+). Filled and open symbols indicate the correlation between burst duration and relaxation times and between mean open times and relaxation times, respectively. Fits in both correlations are shown. Relaxation time constants correlated better with mean open times (with a regression coefficient of 0.9 and slope 1.2) compared with burst duration and relaxation times (with a regression coefficient of 0.80 and slope 8.1).

