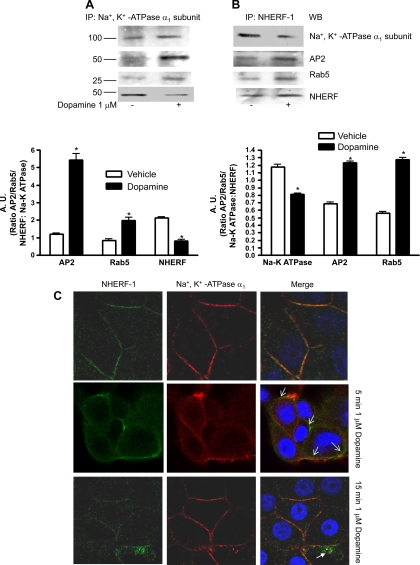
Fig. 1.
Effect of dopamine on association of Na+-K+-ATPase α1-subunit with NHERF-1. A: wild-type (WT) opossum kidney (OK) cells were treated for 15 min with 1 μM dopamine at 37°C. Na+-K+-ATPase α1-subunit (A) or NHERF-1 (B) was immunoprecipitated from crude membranes and analyzed by Western blot analysis using antibodies against AP2, Rab5, NHERF-1, or Na+-K+-ATPase α1-subunit. Bar diagram shows cumulative data from three individual experiments as arbitrary units (A.U.) means ± SE ratio of protein to Na+-K+-ATPase α1-subunit band density. *P < 0.05 by ANOVA followed by Bonferroni's analysis from vehicle-treated cells. C: WT OK cells were treated for 5 or 15 min with 1 μM dopamine at 37°C. Cells were fixed and expression of NHERF-1 (green fluorescence) and Na+-K+-ATPase α1-subunit (red fluorescence) was determined by confocal microscopy. Representative images from three independent experiments are shown. Arrows indicate separation of NHERF-1 from Na+-K+-ATPase α1-subunit after dopamine treatment.

