Fig. 3.
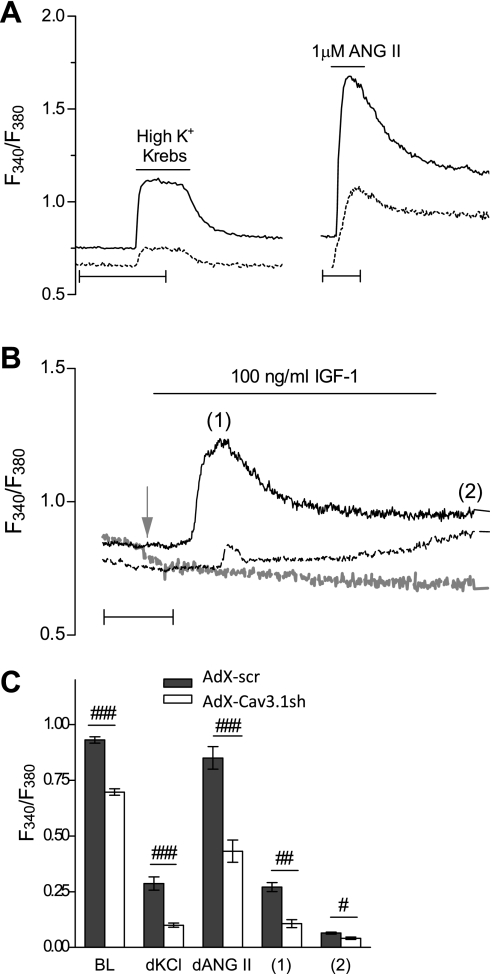
Effect of Cav3.1 knockdown on calcium influx in rat PASMCs. A: intracellular Ca2+ levels measured with fura-2 AM in both AdX-scr- and AdX-Cav3.1sh-infected PASMCs, at least 5 days after infection, expressed as ratio of fluorescence intensity at 340 and 380 nm (F340/F380). Representative traces are for resting levels of Ca2+ and the response to high K+ (60 mM) Krebs or 1 μM angiotensin (ANG) II in AdX-scr- (solid line) and AdX-Cav3.1sh-infected (dotted line) PASMCs. Scale bars represent 50 s. B: representative traces for Ca2+ levels in response to 100 ng/ml IGF-I in 2 mM Ca2+ Krebs solution of AdX-scr- (solid line) or AdX-Cav3.1sh-infected (dashed line) PASMCs, or the response to IGF-I in 0 mM Ca2+ Krebs of AdX-scr-infected PASMCs (dashed shaded line). Time scale represents 2 min. Shaded arrow denotes point of application of Ca2+-free Krebs solution interrupted during preapplication of Ca2+-free Krebs solution. C: quantification of resting baseline (BL) intracellular Ca2+ levels (98 and 72 cells for AdX-scr and AdX-Cav3.1sh) expressed as F340/F380, while high KCl (67 and 65 cells) and ANG II response (72 and 39 cells) are expressed as difference between the peak and the BL (dKCl, dAngII). Ratio is shown for IGF-I-treated cells at peak (1) and at 8 min after IGF-I application (2) in AdX-scr- (n = 61 of 81) or AdX-Cav3.1sh-infected (9 of 18) PASMCs. Values are means ± SE. Statistical significance is calculated using unpaired t-test. ###P < 0.001, ##P < 0.01, and #P < 0.01 for AdX-Cav3.1sh vs. AdX-scr.

