Figure 2.
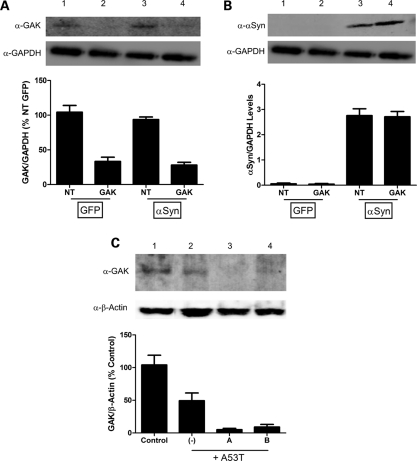
Western blot analyses confirming reduced GAK expression and enhanced α-synuclein accumulation. (A) GAK protein levels and (B) α-synuclein protein levels in HEK 293 cells transfected with either CMV-GFP (lanes 1 and 2) or CMV-α-synuclein (lanes 3 and 4) and non-targeted (lanes 1 and 3) or GAK-specific (lanes 2 and 4) pools of siRNA's. Western blot quantifications were performed via densitometric analysis using NIH ImageJ software. GAK band intensities were normalized first to the GAPDH signal and then to the values for non-targeted, GFP-transfected cells lane (set to 100%) (A), while α-synuclein band intensities were reported as relative expression levels of α-synuclein compared to GAPDH (B). Each experiment was performed in triplicate. (C) Representative western blot depicting shRNA-mediated GAK knockdown in the MES23.5 dopaminergic cell line (n ≥ 2 for each of the different treatment conditions). Lysates were prepared from control cells (lane 1), and cells transduced with A53T-α-synuclein adenovirus alone (lane 2, MOI = 30) or with A53T-α-synuclein adenovirus (MOI = 30) plus lentivirus encoding GAK-specific shRNA ‘A’ (lane 3, MOI = 30) or ‘B’ (lane 4, MOI = 15). The graph below the blot shows relative GAK protein levels determined via densitometric analysis using NIH ImageJ software. GAK band intensities were normalized first to the β-actin signal and then to the normalized GAK band intensity in the control lane (set to 100%). The data suggest that (i) A53T expression induces GAK downregulation in the MES23.5 dopaminergic cell line, and (ii) shRNAs A and B induce a further decrease in GAK levels in A53T-expressing cells.

