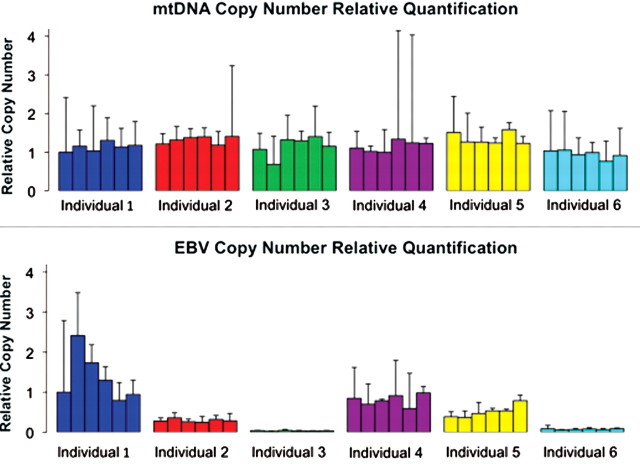
Figure 2.
Relative EBV and mtDNA copy numbers in six unrelated individuals. Data from different individuals (for six LCLs from each individual) are plotted in different colors. The relative copy numbers were calculated using the ‘delta delta Ct’ method, using RNaseP as an endogenous reference gene. These bars are not statistical error per se; rather, they represent the range of possible copy number values defined by the standard error of the delta Ct's.

