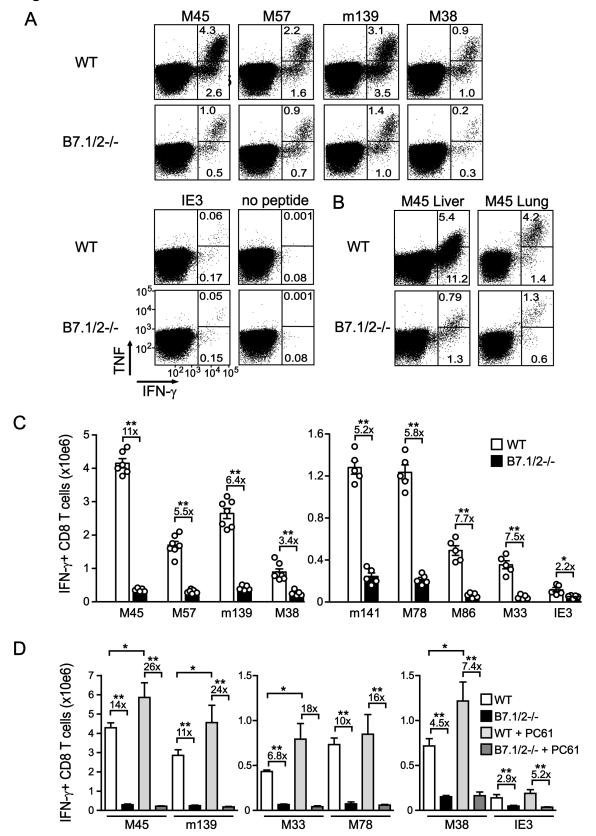
Figure 1. Expansion of MCMV-specific CD8 T cell responses that undergo inflation is less dependent upon B7-CD28 costimulation.
WT and B7.1/2−/− mice were infected with MCMV and 8 days later the virus-specific CD8 T cell response was analyzed by intracellular cytokine staining after restimulation with the indicated class I epitopes. (A and B) Representative flow plots showing the percentage of CD8+ T cells producing TNF and IFN-γ in (A) spleen, (B) liver or lung. (C) Graphs depict the total number of IFN-γ+ CD8 T cells in the spleen. Numbers are shown as means with standard errors (n=5-7 per group) and each symbol (○) represents an individual mouse. (D) Groups of WT and B7.1/2−/− MCMV-infected mice received anti-CD25 mAb (clone PC61) to deplete Tregs. Graphs show the total number of IFN-γ+ CD8 T cells in the spleen at day 8 post-infection. All bar graphs are shown as means with standard errors (n=5 per group). Statistical significance was determined by Student’s t test (* indicates p<0.05 and ** p<0.005). Data shown are representative of two independent experiments.

