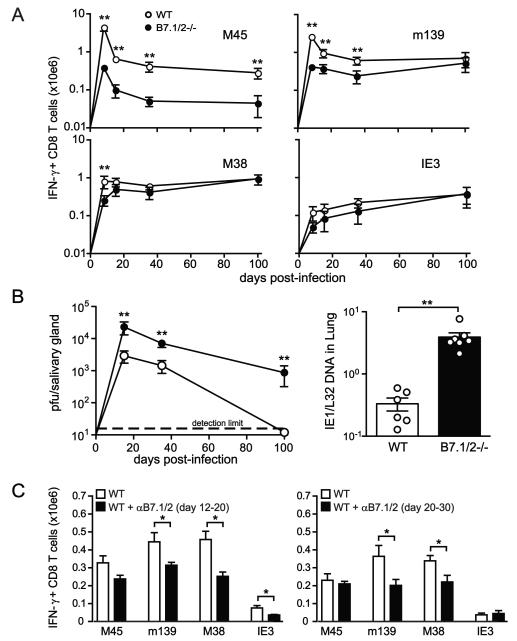
Figure 3. Accumulation of inflationary MCMV-specific CD8 T cells in the absence of CD28-B7 costimulation.
(A) WT and B7.1/2−/− mice were infected with MCMV. Graphs depict the time course analysis of the total numbers of IFN-γ producing MCMV-specific CD8 T cells in the spleen at day 8, 15, 35 and 100 after infection. IFN-γ production was determined by intracellular cytokine staining after restimulation with the MHC class I-restricted peptides M45, M38, m139 and IE3. Data are shown as means with standard errors (5-8 mice per time point). (B) Time course analysis of viral titers in the salivary glands at day 15, 35 and 100 post-infection. Data are shown as means with standard errors (5-8 mice per time point). Bar graph shows MCMV DNA levels in the lung at day 15 post-infection as means with standard errors and each symbol (○) represents an individual mouse. (C) MCMV-infected WT mice were treated with blocking B7.1 and B7.2 antibodies (αB7.1/2) or with control IgG from day 12 to day 20 or from day 20 to 30 post-infection. Graphs show the total number of IFN-γ+ CD8 T cells in the spleen at day 20 (αB7.1/2 blockade day 12-20) or day 30 (αB7.1/2 blockade day 20-30) post-infection after restimulation with the class I peptide epitopes M45, m139, M38 and IE3. Bar graphs are shown as means with standard errors (n=5 mice). Statistical significance of viral titers was determined with the Mann-Whitney test and statistical significance of T cell responses was determined with the two-tailed Student’s t test. All data are the average for 4-8 mice per time point. Differences between groups were considered significant at p-values <0.05 (* indicates p<0.05 and ** p<0.005). Data shown are representative of two independent experiments.

