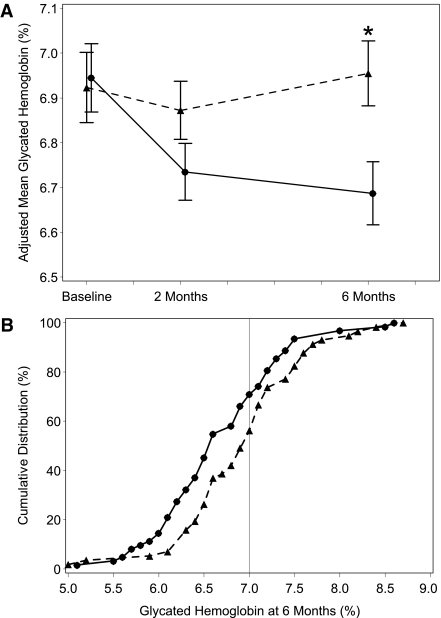
Figure 2.
Glycated HbA1c at 2, 4, and 6 months and cumulative distribution of HbA1c levels at 6 months. Mean values are ± SEs for HbA1c (in %) over the 6-month study period in all patients. The means were adjusted for clinical center and adult or pediatric patient. An asterisk denotes statistical significance for comparison between the continuous monitoring and control groups with P < 0.05 (A); cumulative distribution of HbA1c levels at 6 months among all patients is shown. The vertical line represents the American Diabetes Association target of 7.0% (B). ●, continuous monitoring group; ▲, control group.

