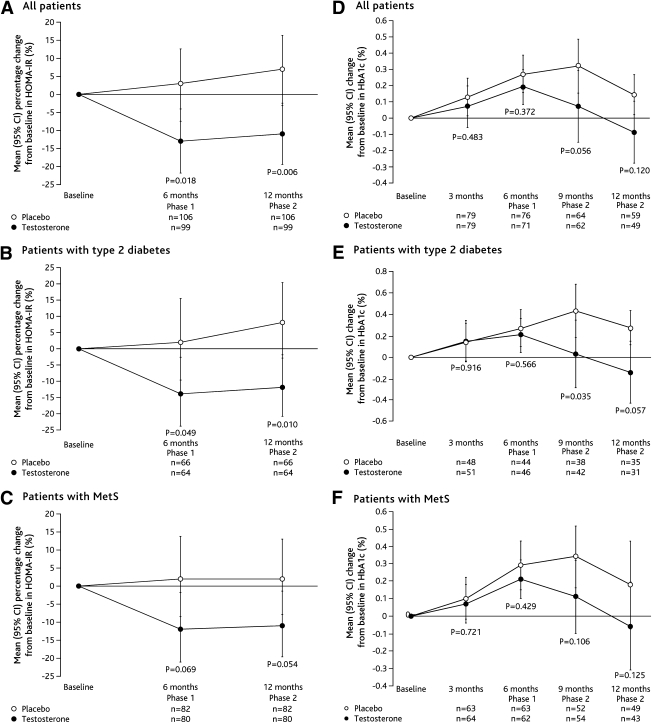
Figure 1.
Mean (95% CI) percentage change from baseline in HOMA-IR (ITT population, last observation carried forward) and change from baseline in HbA1c (ITT population, study completers) among all patients (A and D), patients with type 2 diabetes (B and E), and patients with MetS (C and F). P values reported for comparisons between groups.

