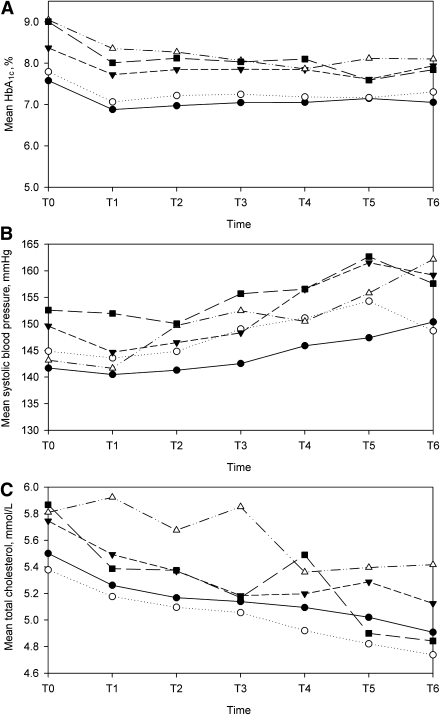
Figure 2.
Course of risk factors of DR over time. Mean HbA1c (A), systolic blood pressure (B), and total cholesterol (C) by clusters of the development of DR. ●, cluster A “persistent no DR.” ○, cluster B “slow regression.” ▲, cluster C “slow progression from minimal to moderate nonproliferative DR.” △, cluster D “fast progression nonproliferative DR to PDR or treated DR.” ■, cluster E “persistent PDR or treated DR.” PDR, proliferative DR.

