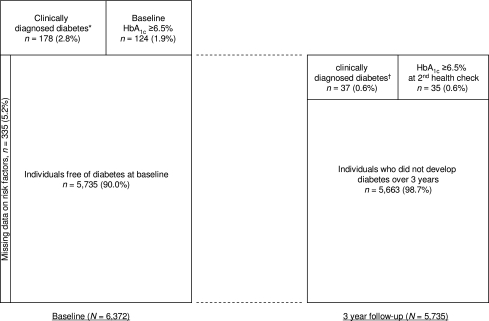
Figure 1.
Schematic diagram demonstrates the numbers and percentages of individuals with prevalent and incidence diabetes in a cohort of 6,372 men and women over 3 years. Individuals with clinically diagnosed diabetes and HbA1c ≥6.5% were considered to have clinically diagnosed diabetes in this diagram. *Self-reported diabetes, evidence of diabetes medications, and dietary modification due to diabetes. †Self-reported diabetes, evidence of diabetes medication, diabetes registers, hospitalizations with diabetes, and diabetes codes on death certificates.

