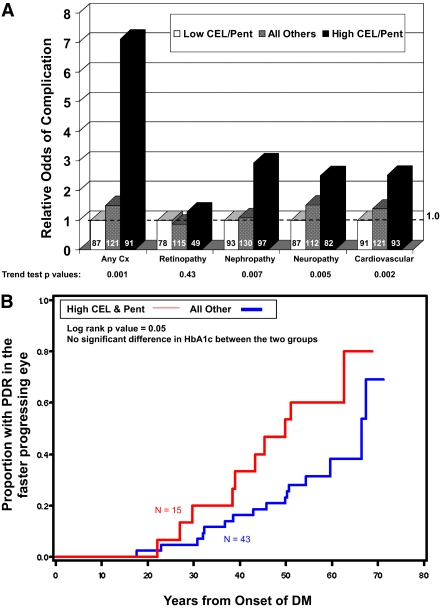
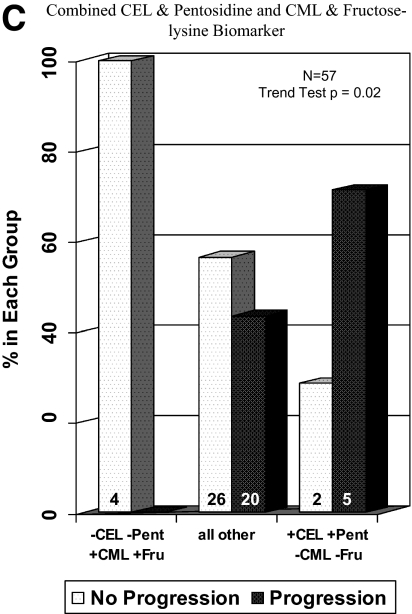
Figure 3.
A: Relative odds of complications associated with high vs. low CEL and pentosidine levels. Cx, complication; Pent, pentosidine. B: Risk of PDR development by CEL and pentosidine levels. DM, diabetes; Pent, pentosidine. C: Progression to PDR in patients grouped by combined CEL and pentosidine and CML and fructose-lysine biomarker. Fru, fructose; Pent, pentosidine. (A high-quality color representation of this figure is available in the online issue.)


