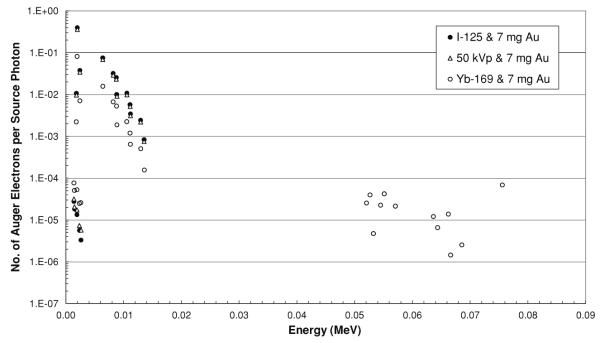
Figure 9.
Auger electron spectra within a 3 × 3 × 3 cm3 tumor irradiated by 125I, 50 kVp and 169Yb sources located at the center of the tumor. The spectra are shown only for a tumor loaded with gold nanoparticles at 7 mg g−1, because Auger electrons above 1 keV are not seen for a tumor without gold nanoparticles. No distinction between the Auger and Coster-Kronig electrons is made for these spectra.

