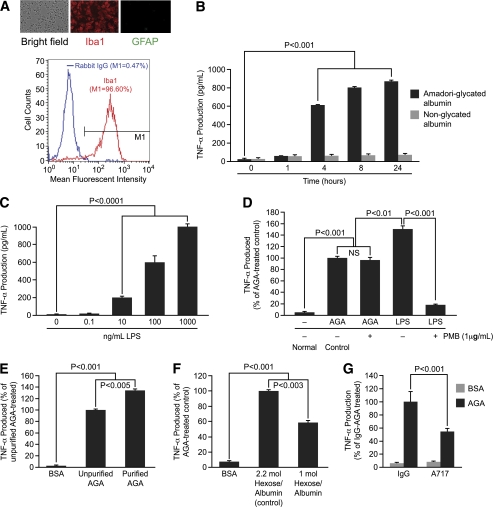
FIG. 3.
AGA induces TNF-α release by retinal microglial cells in vitro. A: Characterization of retinal microglial cells by immunocytochemistry and flow cytometry. The panel contains a bright field view and immunodetection of Iba1 (red), GFAP (green), and flow cytometric analysis to determine cell purity. For flow cytometry analysis, cells with fluorescent intensity in M1 region were determined as positive for Iba1 and their percentage in the total population is shown. Normal rabbit IgG was used as control. B: Time-dependent release of TNF-α in AGA-treated retinal microglial cells. Cells were treated with AGA (500 μg/mL) or an equal level of nonglycated albumin for the indicated time. TNF-α levels in the culture media were measured by ELISA. Data shown are the mean ± SD of three experiments. C–G: TNF-α production in microglial cells after 4-h incubation with (C) purified lipopolysaccharide (0.1–1,000 ng/mL); (D) media containing 1 μg/mL LPS or 500 μg/mL AGA in the presence or absence of 1 μg/mL polymyxin B; (E) 500 μg/mL of BSA, unpurified, purified AGA; (F) 500 μg/mL of BSA, AGA with 2.2 mol hexose/albumin, or 1 mol hexose/albumin; (G) 500 μg/mL of BSA or AGA neutralized by A717 or IgG, which served as isotypic control. Data shown are the mean ± SD of three experiments. PBM, polymyxin B. (A high-quality color representation of this figure is available in the online issue.)

