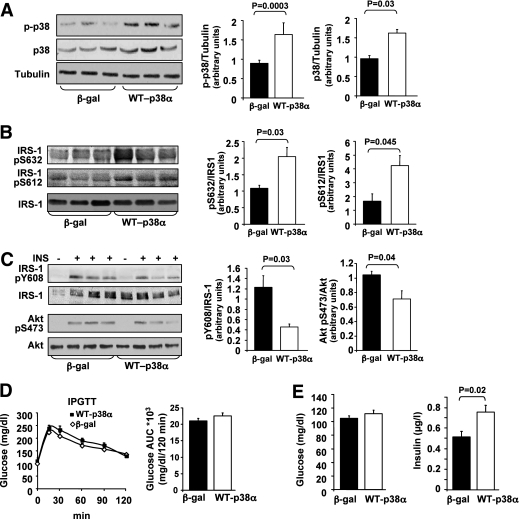
FIG. 2.
Effects of adenoviral p38MAPKα overexpression in the liver, on insulin signaling, and glucose tolerance in C57/BL6 mice. A: C57 male mice were infected with β-gal (n = 15) or WT-p38α (n = 15) adenoviral constructs via tail vein injection. The levels of p38α, p-p38, and α-tubulin in the liver were assessed using Western blot analysis. Quantification of immunoblots was performed using ImageJ analysis. The results are expressed as p-p38 or p38 relative to the loading control (α-tubulin) and are presented as the means ± SE. B: Levels of IRS-1-pSer632, IRS-1-pSer612, and IRS-1 in the liver were determined by immunoblotting with specific antibodies as indicated. Quantification of immunoblots was performed using ImageJ analysis. The results are expressed as IRS-1-pSer632, IRS-1-pSer612, relative to IRS-1, and are presented as the means ± SE. C: Mice infected with β-gal (n = 5) or with WT-p38α (n = 5) adenoviral constructs were treated with insulin as described in research design and methods. Insulin-induced Tyr phosphorylation of IRS-1 and Akt activation was analyzed by antibodies against IRS-1-pTyr608, IRS-1, Akt-pSer473, and Akt. Quantification of immunoblots was performed using ImageJ analysis. The results are expressed as IRS-1-pTyr608 relative to IRS-1 and Akt-pSer473 relative to Akt and are presented as the means ± SE. D: IPGTT was performed 5 days after adenovirus injection, after 12-h fasting. The AUC was estimated as described in Fig. 1C. E: Blood glucose and insulin levels were measured after 12-h fasting.

