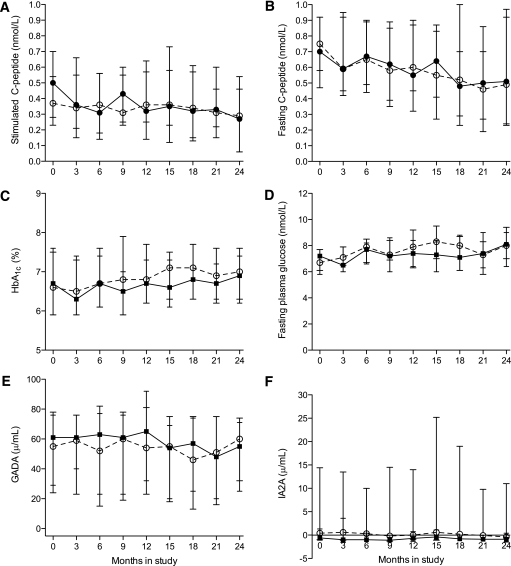
FIG. 1.
Trial outcomes: stimulated serum C-peptide (A), fasting serum C-peptide (B), blood HbA1c (C), fasting plasma glucose (D), serum GADA (E), and serum IA2A (F). Median values for the nasal insulin and nasal placebo groups are indicated by closed and open symbols, respectively. Interquartile ranges are shown as vertical lines.

