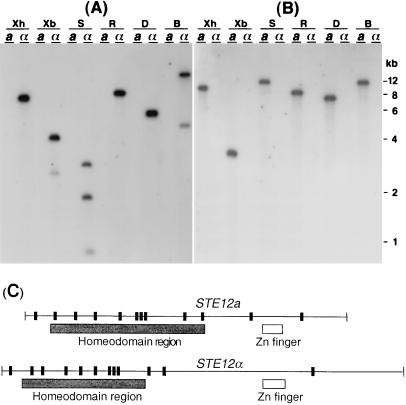
Figure 1.
Detection and structure of STE12a and STE12α. (A) Southern blot analysis of STE12α. (B) Southern blot analysis of STE12a. DNAs of B-4500 (MATα) and B-4476 (MATa) were digested with different restriction enzymes, fractionated on an agarose gel, and transferred to a nylon membrane. The resulting blot was hybridized with a probe of STE12α cDNA (A) or STE12a cDNA (B) and washed at low stringency. B, BamHI; D, HinDIII; R, EcoRI; S, SalI; Xb, XbaI; Xh, XhoI. (C) Structure of STE12a- and STE12α-coding region. Vertical bars represent the intron positions.

