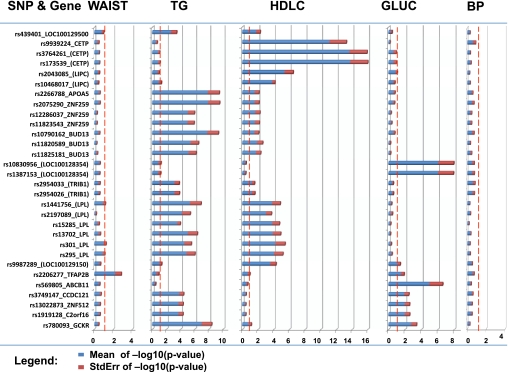
FIG. 2.
Top significant SNPs from meta-analyses of MetS and bivariate traits associations, tested now for their association with dichotomized risk traits (WC, HDLC, TG, GLUC, and BP) as defined in the MetS NCEP definition. The results shown in the graph are the sample weighted mean of negative log10 P values (blue bars) per trait association, for all studies combined. On the top of blue bars (mean) added are the corresponding standard errors (red bars) of these negative log10 P values. The minimal threshold of negative log10 (0.05) P value is shown with a vertical red dashed line. A gene name in parentheses means the corresponding SNP is located in a region near the gene. (A high-quality color representation of this figure is available in the online issue.)

