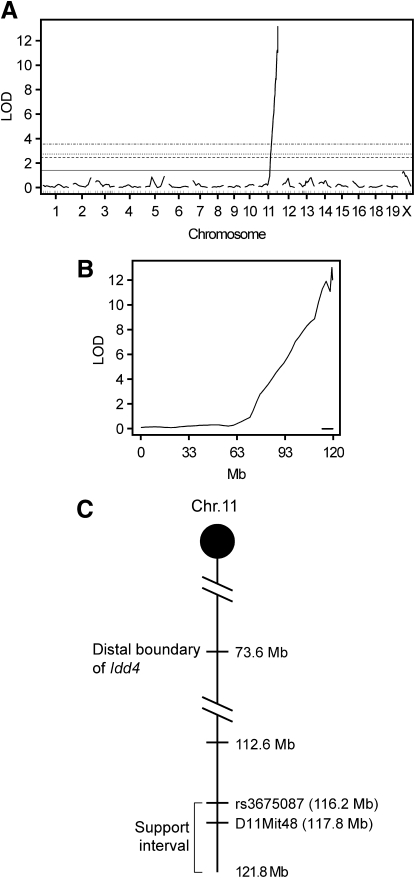
FIG. 2.
A single genetic locus primarily contributes to B6.H2g7 susceptibility to AI4 T-cell–induced diabetes. Whole genome (A) and chromosome 11–specific (B) LOD score analysis of SNP markers linked to diabetes susceptibility and insulitis severity in sublethally irradiated BC1 recipients of 1 × 10⁷ NOD.Rag1null.AI4 splenocytes. Horizontal lines depict LOD scores indicative of 1, 5, 10, and 63% linkage support thresholds. The 1 and 63% thresholds, respectively, indicate significant and suggestive linkage. The lower bold line indicates the 95% CI for linkage. C: Schematic representation of the distal region of chromosome 11. The positions of the markers (Mb) are based on NCBI build 37. The distance between markers is not drawn to scale.

