FIGURE 3.
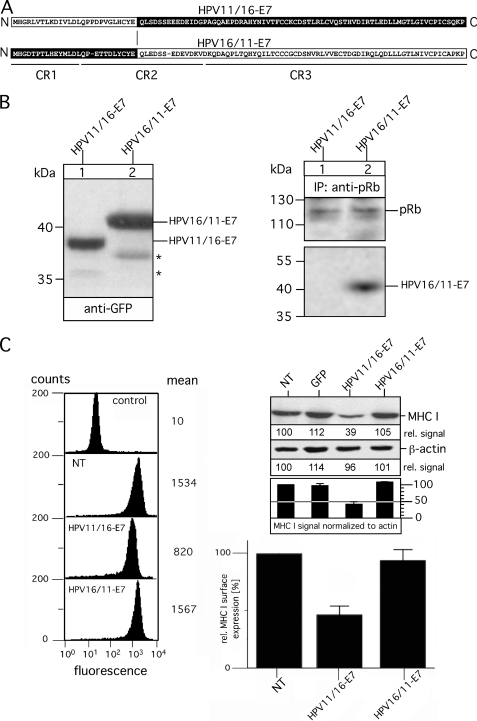
Analysis of chimeric variants HPV11/16-E7 and HPV16/11-E7. A, shown is a schematic overview of chimeric variants HPV11/16-E7 and HPV16/11-E7. Polypeptide regions of HPV11-E7 are indicated in white, whereas the regions of HPV16-E7 are shown in black. Sequence regions CR1, CR2, and CR3 are underlined. B, expression of HPV11/16-E7 and HPV16/11-E7 in stably transfected HEK-293 cells (left panel) is shown. Cell lysates of the transfectants were separated on a 15% SDS-Gel and blotted onto nitrocellulose as described under “Experimental Procedures.” Western blots were probed for the GFP tag by using mAb B-2. Complex formation with pRb was analyzed by immunoprecipitations (IP; right panel). Anti-pRb immunoisolated precipitates from Triton X-100-lysed transfectants were separated on a 15% SDS gel and analyzed in Western blots probed with Abs to pRb and GFP. Asterisks indicate minor bands detected with anti-GFP antibody. C, surface expression of MHC I was assessed by flow cytometry using the mAb W6/32 (left panel, second to fourth analysis, from the top). Background staining was analyzed by incubating with secondary Ab alone (control, upper analysis). Data are representative of three independent experiments (see the histogram, lower right panel). Steady-state expression of MHC I was analyzed by Western blot probed with mAb 3B10.7 (upper right panel). Anti-β-actin staining served as the internal control for equal protein loading. MHC I and β-actin signals were quantitated by densitometric scanning. Four different exposures of the immunoblot were taken to ensure linearity, and the obtained MHC I signals were normalized to the corresponding β-actin signals (see the histogram below the immunoblot). One representative exposure of the Western blot is shown in C, upper right panel. NT, non-transfected.

