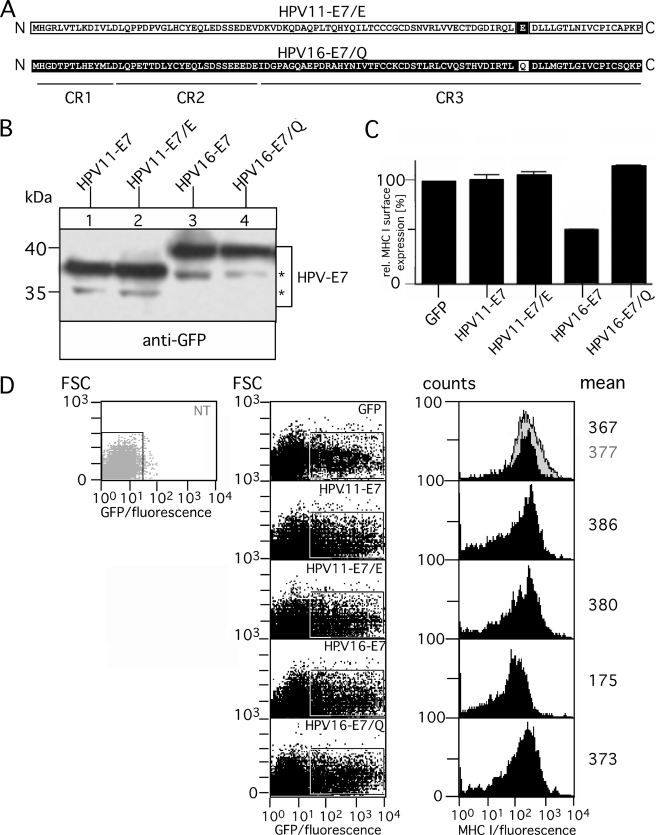
FIGURE 5.
Analysis of chimeric variants HPV11-E7/E and HPV16-E7/Q. A, shown is a schematic overview of chimeric variants HPV11-E7/E and HPV16-E7/Q. Polypeptide regions of HPV11-E7 are indicated in white, whereas the corresponding regions of HPV16-E7 are shown in black. Regions CR1, CR2, and CR3 are underlined. B, expression of HPV11-E7/E and HPV16-E7/Q in transiently transfected HEK-293T cells (left panel) is shown. Cell lysates of the transfectants were analyzed by Western blot as described above. Asterisks indicate minor bands detected with antibody to GFP. C, surface expression of MHC I was assessed by flow cytometry using the mAb W6/32. Data are representative of three independent experiments of which one study is shown in D. D, 24 h after transient transfection GFP- and GFP-tagged HPV-E7-positive HEK-293T cells were determined by flow cytometry based on their GFP-fluorescent intensity (forward scatter (FSC) versus GFP-fluorescence dot plot; left panel). The histogram plots of MHC I surface expression (right panel) were gated on the population non-transfected (NT)/GFP-negative (filled gray histogram) and GFP-positive HEK-293T cells (filled black histograms).

