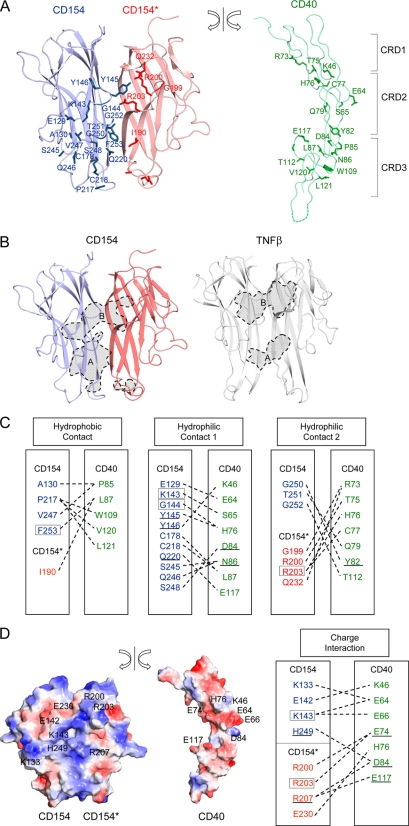
FIGURE 2.
Structure of the CD40-CD154 interaction interface. A, the CD40 molecule is split from the bound CD154 and rotated to show the interaction interface. Residues directly contacting ligand or receptor are drawn. B, the CD40 contact area in CD154 and TNFR1 contact area in TNFβ are marked with broken lines and colored in gray. The contact areas can be divided into A and B patches (see text). C, residues making direct contacts are linked by broken lines, and residues found in hyper-IgM patients are boxed. The underlined residues were studied in previous mutagenesis research and proven to be critical for ligand-receptor interaction. D, surface representation of CD154 and CD40. The orientation is as in A. Positively and negatively charged surfaces are blue and red, respectively (left). Residues making critical charge interactions are linked by broken lines (right).

