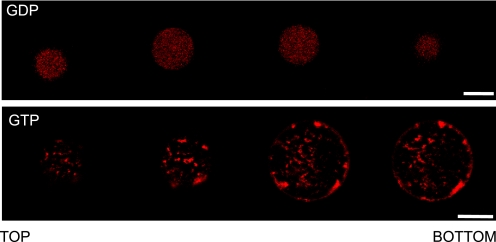
FIGURE 2.
Spatial distribution of Alexa 647-labeled FtsZ inside GUIMVs. Upper panel, image analysis of FtsZ inside GUIMVs formed in the presence of 0.1 mm GDP. Shown are sequential cross-sectional images (taken every 4 μm) of GDP-FtsZ (Alexa 647-labeled) inside GUIMVs. The whole collection of images showed the same pattern (supplemental Fig. S2C). Lower panel, image analysis of FtsZ inside GUIMVs formed in the presence of 0.5 mm caged GTP. Shown is a selection of cross-sectional images of Alexa 647-labeled FtsZ polymers inside GUIMVs. The image series begins on the outer wall of the GUV and progressively moves in the z-axis toward the opposite side of the vesicle through the GUV equator. The whole collection of images showed the same pattern (supplemental Fig. S3C). Scale bars = 10 μm.

