FIGURE 3.
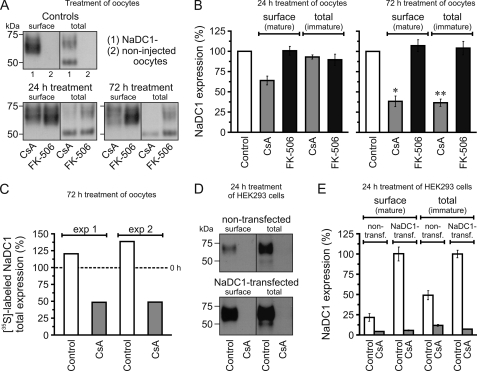
Effect of CsA on NaDC1 expression. A and B, Western blot analysis: heterogeneously glycosylated NaDC1 forms have an apparent molecular mass ranging from ∼60 to ∼75 kDa, the immature NaDC1 form 50 kDa. Treatment with 50 μm CsA for 24 h and 72 h reduced cell surface expression of NaDC1, total expression (immature form) was only reduced by 72 h treatment. Treatment with 5 μm FK-506 had no effect. Data were normalized to control values and expressed as %. C, two metabolic labeling experiments with [35S]Met/Cys: 50 μm CsA treatment for 72 h reduced total newly synthesized NaDC1 proteins by ∼80%. Data were normalized to values obtained with the same treatment at 0 h and expressed as %. Dashed line: controls at 100%. D and E, Western blot analysis: 10 μm CsA treatment for 24 h almost completely abrogated cell surface and total NaDC1 expression in non- and NaDC1-transfected HEK293 cells. As with oocytes, only the 50 kDa band density was measured to determine total expression. Data were normalized to values obtained with non-treated NaDC1-transfected cells and expressed as %. In B and E, data are shown as averages (± S.E.) of 3–5 experiments. To average the total expression, data were first normalized to the actin values. In B, all treatments with CsA are statistically different from control (p < 0.05), except the 24 h treatment (total). * and **, significant difference between 24 h and 72 h treatments with CsA (p < 0.05 and 0.001, respectively). In E, all treatments with CsA are statistically different from control (p < 0.05).

