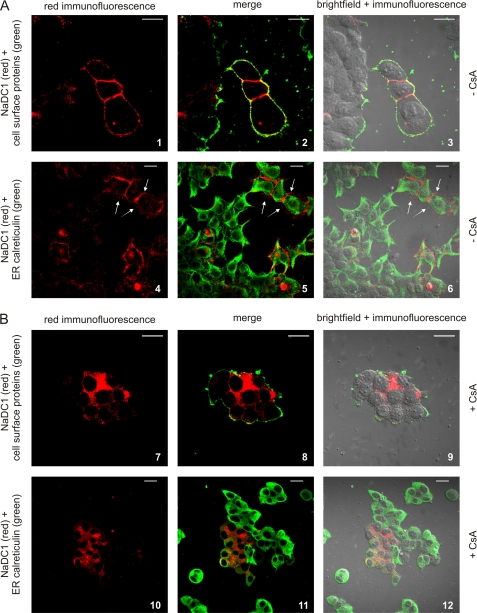
FIGURE 4.
Immunofluorescence studies in HEK293 cells. NaDC1-expressing HEK293 cells were not treated (A, −CsA) or treated with 10 μm CsA (B, +CsA) for 24 h. NaDC1 (red) was co-stained with the cell surface marker biotin (green; images 1–3 and 7–9) or the ER marker calreticulin (green; images 4–6 and 10–12). NaDC1 co-localized with biotin at the cell surface in non-treated cells (images 2, 3) but not after CsA treatment (images 8, 9). NaDC1 did not co-localize with calreticulin in non-treated cells (images 5, 6) or after CsA treatment (images 11, 12). Shown are representative 80× (no treatment) or 60× (CsA treatment) images. Scale bars: 20 μm.

