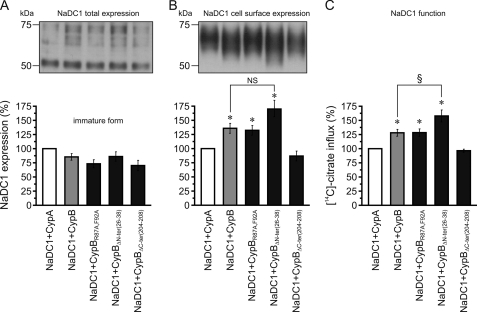
FIGURE 5.
Co-injection studies in oocytes. NaDC1 was injected with wt CypA (white bars), wt CypB (gray bars), or mutant CypB (black bars). CypB mutants: CypBR87A,F92A, enzymatically inactive; CypBΔN-ter(26–38), nuclear translocation signal depleted; CypBΔC-ter(204–208), ER retention sequence depleted. Western blot analysis: A, immature NaDC1 form expression remained unchanged in all co-injections. B, NaDC1 cell surface expression increased with CypB, CypBR87A,F92A, and CypBΔN-ter(26–38), compared with CypA and CypBΔC-ter(204–208). C, functional analysis showing perfect correlation between NaDC1 function and its cell surface expression. Data were normalized to values obtained with oocytes co-expressing NaDC1 and wt CypA, expressed as %, and shown as averages (± S.E.) of 4–11 experiments. To average the total expression, data were first normalized to the actin values. *, significant difference to NaDC1+CypA control (p < 0.05); NS, not statistically different between NaDC1+CypB and NaDC1+ CypBΔN-ter(26–38); §, significant difference between NaDC1+CypB and NaDC1+ CypBΔN-ter(26–38) (p < 0.05).

