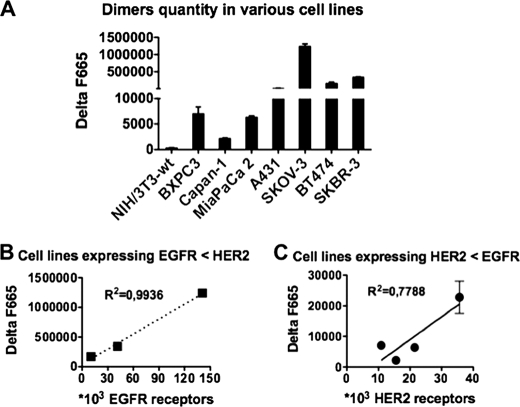
FIGURE 3.
Quantification of EGFR/HER2 dimers in different cancer cell lines using the antibody-based TR-FRET assay. A, 3.2 × 10⁵ cells were incubated at 37 °C with d2-labeled m425 (anti-EGFR) Lumi4 Tb-labeled FRP5 (anti-HER2) antibodies overnight. Cells were then stained with 10 μg/ml of Hoechst 33342 and washed three times with KREBS buffer before detection of the fluorescence signals (see “Experimental Procedures” for a complete description of the protocol used). The ΔF665 value represents the EGFR/HER2 dimer concentration normalized to the DNA quantity (Hoechst fluorescence). Data are the mean ± S.E. of three independent experiments performed in triplicate. B, correlation curve between EGFR/HER2 dimer quantity and EGFR expression (determined previously using the quantitative immunofluorescence indirect assay, see Table 1) in cancer cell lines with higher HER2 than EGFR expression level. C, correlation curve between EGFR/HER2 dimer quantity and HER2 expression in cancer cell lines with higher EGFR than HER2 expression level.

