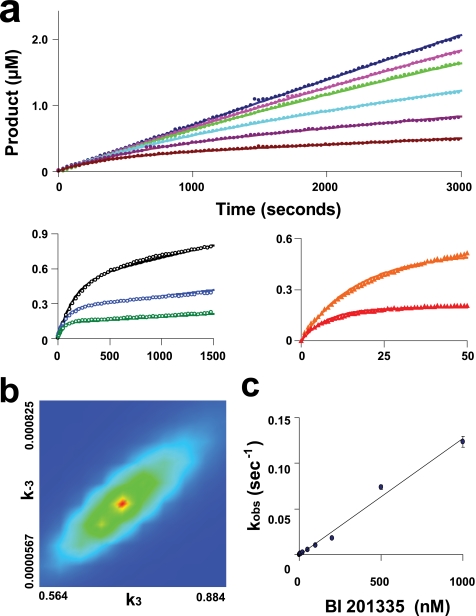
FIGURE 5.
Kinetics of binding of BI 201335 to FL-protease. The time dependence of product formation is shown for the hydrolysis of 10 μm substrate by various concentrations of FL-protease and in the presence of different concentrations of BI 201335 (Table 2, data set 3 for the FL-protease-BI 201335 combination). a, activity of 1 nm FL-protease in the presence of 0, 1, 2, 5, 10, and 20 nm BI 201335 (top panel); activity of 5 nm FL-protease in the presence of 50, 100, and 200 nm BI 201335 (bottom left panel); and activity of 50 nm FL-protease in the presence of 500 and 1000 nm BI 201335 (bottom right panel). Axis units for bottom graphs are identical to those for the top graph. The solid lines correspond to the global nonlinear regression fit of the data. Only a portion of the collected data points are graphed to allow visualization of these curves. b, confidence contour showing the limits of k3 and k−3 parameters, and the goodness of constraint by the raw data for these fitted parameters in a one-step binding mechanism fit. c, analytically determined apparent rates of inhibition (kobs) plotted against BI 201335 concentration. Standard deviations were calculated from the values of four individual data sets at each BI 201335 concentration and are indicated by vertical bars on each point in the graph.

