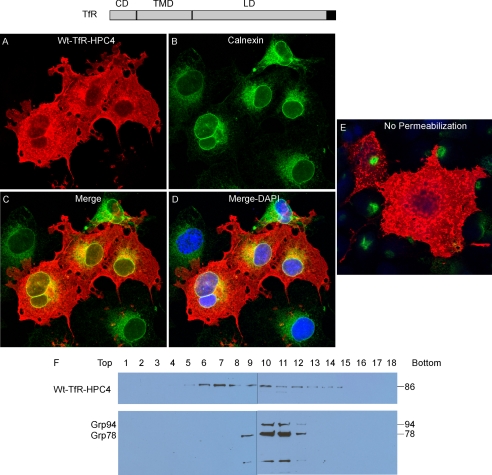
FIGURE 2.
Localization of wtTfR. A–D, immunofluorescent staining of wtTfR. Cells were stained with anti-HPC4 (red) antibody and anti-Calnexin (green). Merge, yellow. DAPI, blue. E, transfected cells not treated with Triton X-100 were stained with anti-HPC4 (red) antibody and anti-calnexin (green). F, sucrose gradient subcellular fractionation. The PNS was applied to a sucrose gradient and 18 fractions (top to bottom) were obtained after ultracentrifugation. Proteins from each fraction were analyzed on Western blot with anti-HPC4 and anti-KDEL antibodies.

