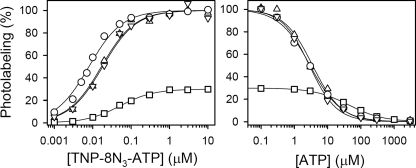
FIGURE 4.
TNP-8N3-ATP (left panel) and ATP (right panel) concentration dependences of photolabeling of Ca2+-ATPase in the E2·Tg·AlF state. Formation of the E2·Tg·AlF state with SR was accomplished by first forming the E2·Tg state, followed by supplementation with AlCl3, NaF, and MgCl2 to final concentrations of 0.5, 2, and 0.2 mm, respectively (triangles pointing downward), or by first forming the E2·AlF state, followed by supplementation with 1 μm Tg (triangles pointing upward), and further incubation for 30 min at 25 °C. TNP-8N3-ATP photolabeling was then carried out at the indicated concentrations of TNP-8N3-ATP without ATP (left panel) or at 3× the K0.5 for TNP-8N3-ATP with the indicated concentrations of ATP (right panel). For comparison, results with SR in the E2·Tg (squares) and E2·AlF states (circles) (cf. Fig. 2) are included in the panels. In each case, the labeling level (in %) is shown relative to the labeling level of E2·AlF.

