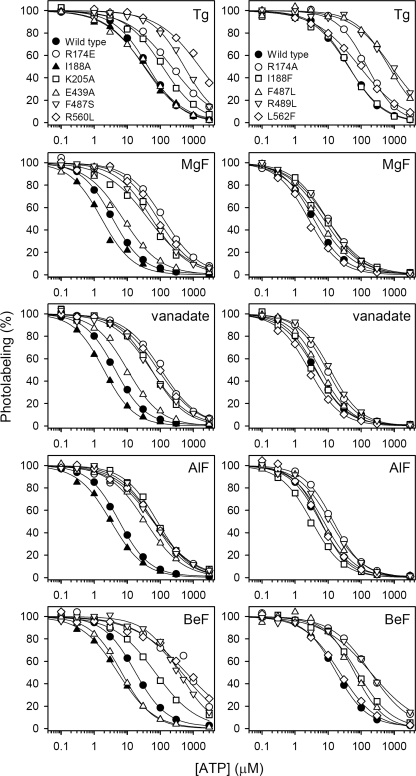
FIGURE 5.
ATP concentration dependences of photolabeling of Ca2+-ATPase mutants stabilized in the intermediate states occurring during E2P dephosphorylation. Expressed Ca2+-ATPase was incubated with Tg, MgF, vanadate, AlF, or BeF as described under “Experimental Procedures,” and subjected to TNP-8N3-ATP photolabeling at 3× the K0.5 for TNP-8N3-ATP (the TNP-8N3-ATP concentration dependences are shown in supplemental Fig. S6) in the presence of the indicated concentrations of ATP. In each case, the maximum level of specific labeling was defined as 100%. The affinity constants determined are listed in Table 2. Symbols for the five panels above each other are indicated in the top panels.

