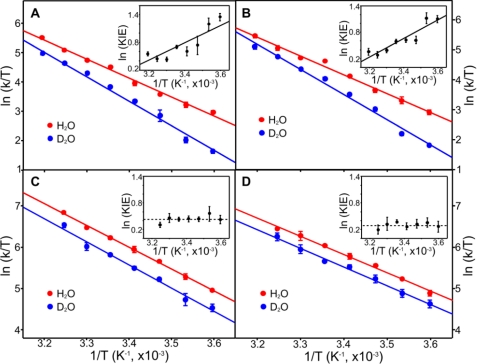
FIGURE 4.
Temperature dependence of the rate constants for the proton transfer step. Eyring plots of ln(kobs/T) versus 1/T for the proton transfer step in H2O and D2O are shown for POR from T. elongatus (A), Synechocystis sp. PCC6803 (B), G. violaceus (C), and A. thaliana POR B (D). Data are shown fitted to the Eyring equation. Activation enthalpies (ΔH‡) and activation entropies (ΔS‡) are shown in Table 1 and supplemental Table S2. Error bars were calculated from the average of at least five kinetic traces. The insets show the dependence of ln KIE as a function of 1/T.

