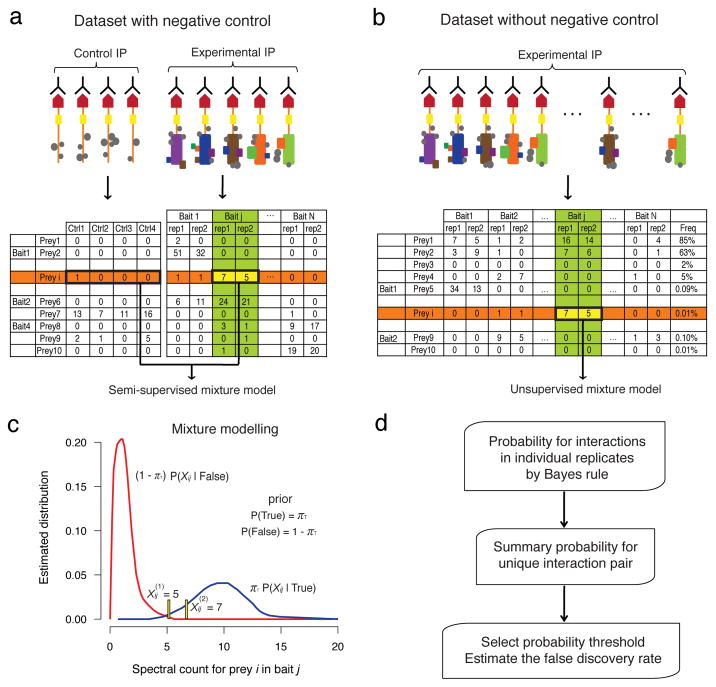
Figure 1. Probability model in SAINT.
a–b Interaction data in the presence (a) and absence (b) of control purifications. Top: schematic of the experimental AP-MS procedure; Bottom: illustration of a spectral count interaction table. c. Modeling spectral count distributions for true and false interactions. For the interaction between prey i and bait j, SAINT utilizes all relevant data for the two proteins, as shown in the column of the bait (green) and the data in the row of the prey (orange) in a and b. d. Probability is calculated for each replicate by application of Bayes rule, and a summary probability is calculated for the interaction pair (i,j).

