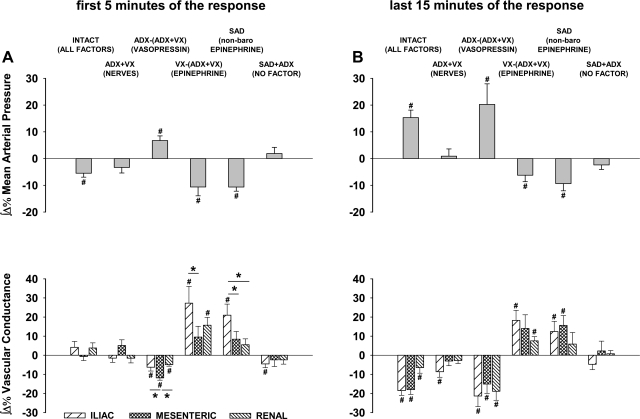
Fig. 4.
Integral hemodynamic responses (iliac, mesenteric, and renal) evoked by selective stimulation of A1 adenosine receptors located in the NTS. Data were calculated from traces presented in Fig. 3. A: integrals measured over the first 5 min of the responses, when decreases in MAP and vasodilation prevailed. B: integrals measured over the last 15 min of the responses, when increases in MAP and vasoconstriction prevailed. Data are means ± SE. *P < 0.05 between vascular beds linked with the horizontal lines. #P < 0.05 vs. 0. Abbreviations are as in Fig. 2.

